Johns Creek is more than a collection of neighborhoods. Its home values move in small, concentrated patterns that serious buyers and sellers can read and use. This article explains the practical signals that form a local home value map and how to apply them whether you are buying your first home, upsizing, downsizing, or selling for the best return.
Start with the three data points that show where values are headed: inventory, days on market, and list to sale ratio. When inventory falls while days on market shorten and list to sale ratios climb, that neighborhood is likely appreciating faster than the city average. Track these metrics on a rolling 30 to 90 day basis to avoid reacting to brief spikes. These are the cornerstone markings on your Johns Creek home value map.
School microzones and commute corridors create distinct pockets of demand inside Johns Creek. A top-rated elementary or a short drive to GA 141 can push buyers toward a specific subdivision even if it's only a few blocks from another with lower demand. Identify the school boundaries and principal commute routes that matter to your buyer profile. That is where premium pricing and faster sales often appear.
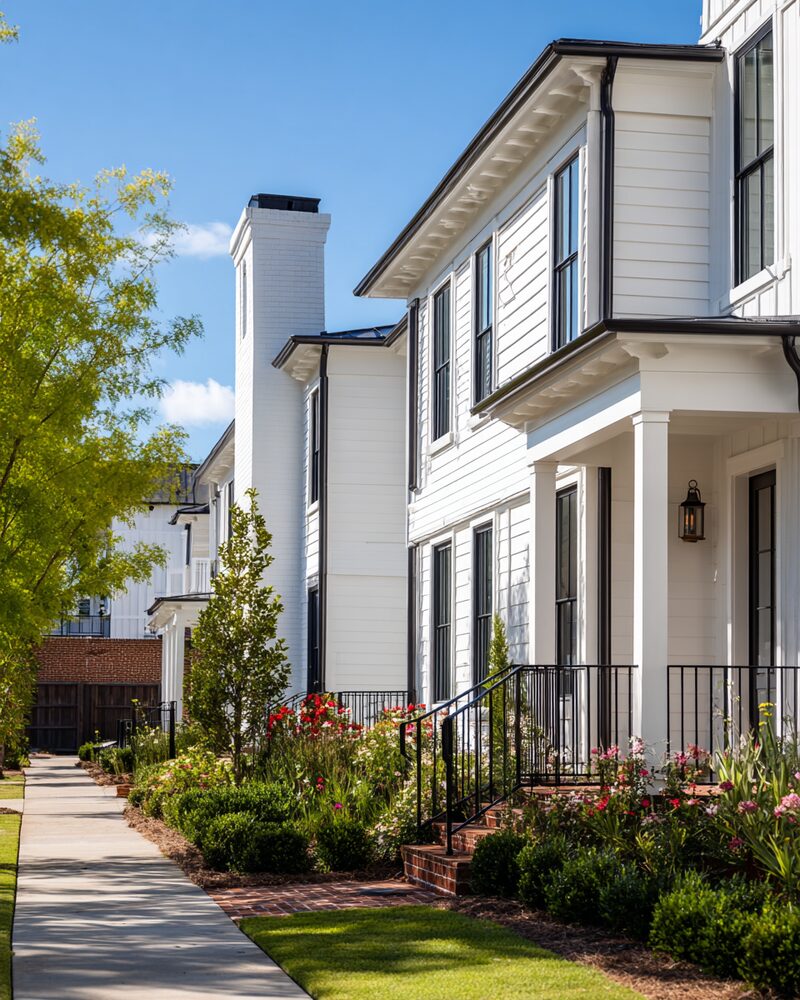
Housing stock and lot characteristics matter as much as headline numbers. Ranch homes, townhomes, and newer builders each attract different buyer sets. Pay attention to lot depth, tree cover, and backyard usability if outdoor living is in demand. For sellers, highlighting the features buyers search for in your property class increases perceived value without a large investment.
Small projects tend to yield the biggest immediate return in Johns Creek. Fresh paint in neutral tones, updated lighting, and decluttering the main living spaces create strong online impressions and reduce days on market. Sellers who invest strategically in kitchen hardware, smart thermostats, or refreshed landscaping often see a measurable uptick in showings and competitive offers.
Buyers can use the home value map to decide where to compromise. If schools are nonnegotiable, accept a smaller yard or a longer commute. If proximity to restaurants and parks matters, target neighborhoods with shorter history of appreciation but rising demand. Always compare price per square foot and recent solds within a 0.5 mile radius rather than relying on citywide averages.
Pricing and timing still win deals. For sellers, list price within 3 percent of the market-supported value for the first week to capture peak search visibility and showings. For buyers, write offers that reflect market signals: stronger escalation clauses in hot pockets, or contingencies in slower segments. Use objective comps and transparent communication to keep deals moving.
Market shifts like rising mortgage rates or increased new construction are part of the landscape. Instead of guessing long term, tie decisions to short-term signals on your map: inventory trends, buyer traffic, and recent contract activity. That approach keeps your strategy relevant whether interest rates change or a new development breaks ground nearby.
Local expertise speeds interpretation of the map. A neighborhood that looks similar on paper can have different momentum because of HOA changes, school boundary proposals, or planned commercial development. For a tailored read of the Johns Creek home value map and when to act, contact The Rains Team at 404-620-4571 or visit
www.rainsteamjohnscreek.com. We provide custom reports, on-the-ground insights, and proven strategies that make the difference in today's market and years to come.